

In 2025, advertising on Facebook (Meta) looks very different from what many of us are used to. With AI becoming deeply integrated into ad platforms, combined with stricter iOS privacy rules and increasing signal loss, it is getting harder for advertisers like you and me to track user behavior and truly optimize campaigns.
There are seven Facebook Ads performance metrics of top importance in 2025, standing tall against the noise and allowing you to stay focused on what really impacts a business. By keeping track of these, you will get to counterbalance the evolving challenges, adjust respective changes to your strategy, and ensure that the Meta ads aren’t just running, but the ads are giving those results.
Facebook Ads performance metrics: Are Your Ads Actually Working?
Performance metrics answer the big question: Are your ads achieving the goals you set? Whether your aim is driving sales, generating leads, or increasing brand awareness, these numbers tell you how well you’re doing, and at what cost.
It depends on your campaign objective:
- For sales campaigns, results show how many purchases were made on your website.
- If you’re after leads, results track how many people signed up or shared their contact info.
- For brand awareness, results could be impressions (how many people saw your ad) or website visits.
Some better examples include:
- Website Purchases: Total items bought from your site.
- Leads: New potential customers submitting their details.
- Form Leads: People submitting forms directly on Facebook through Lead Ads.
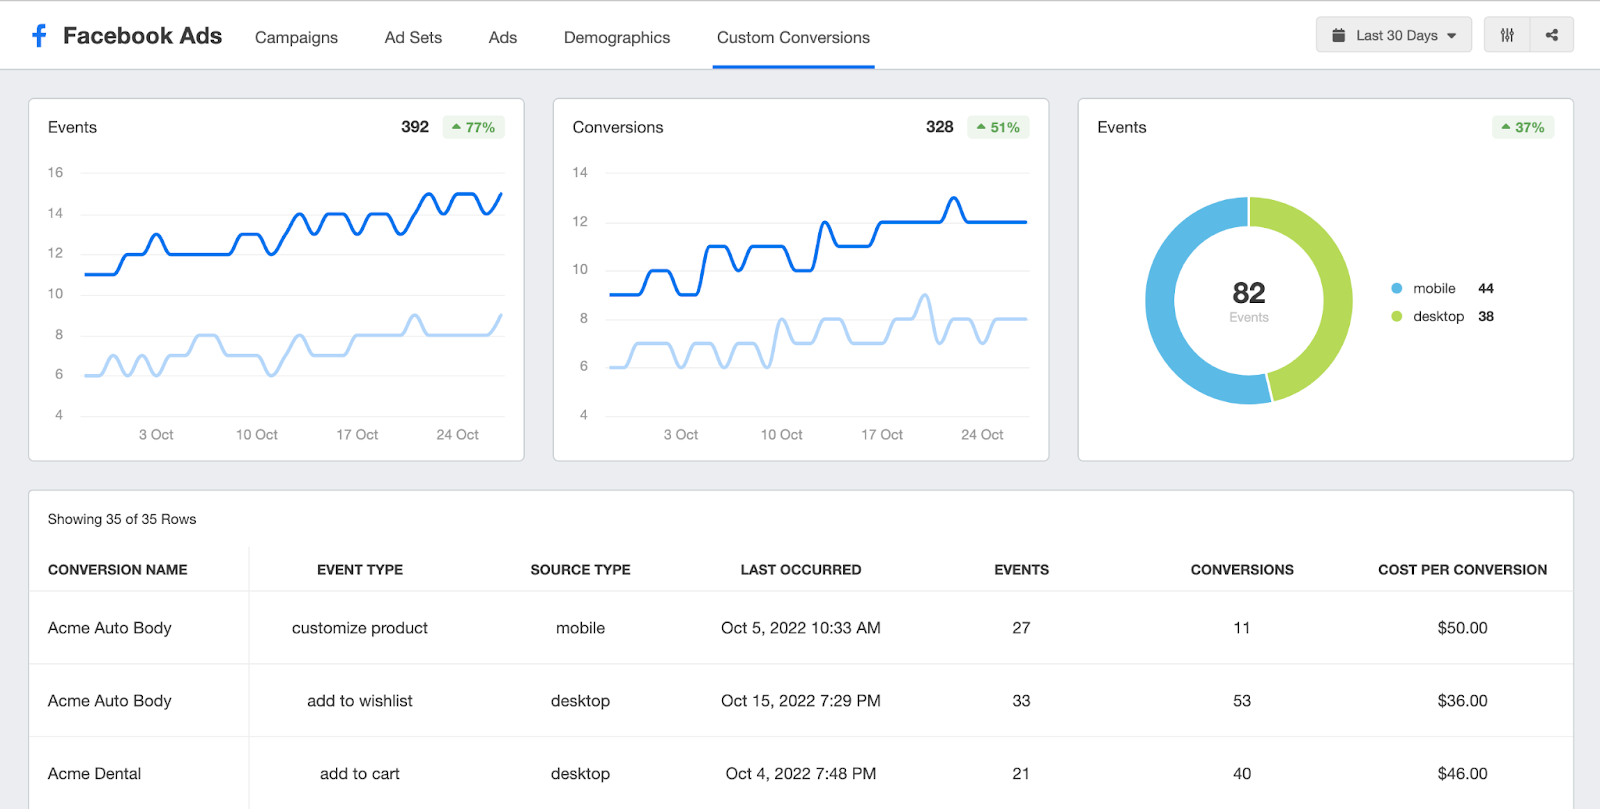
- Custom Conversions: Specific tracked actions like eBook downloads, webinar sign-ups, or free trial registrations powered by the Facebook Pixel.
Let’s start with the first and one of the most important metrics:
1. Cost Per Action (CPA): Not Just Clicks
When it comes to measuring the true effectiveness of your Facebook Ads performance metrics, Cost Per Action (CPA) stands out as a far more meaningful metric than just clicks.
CPA tracks how much you spend for each valuable user action such as a purchase, a lead submission, signing up for an event, or any other conversion that actually drives your business forward.
Why CPA Matters More Than Ever in 2025?
Privacy changes like iOS updates restricting tracking have made traditional metrics like Cost Per Click (CPC) less reliable. A click doesn’t guarantee action; users might click out of curiosity, skewing your CPC and distorting campaign performance.
Real-World Impact and Tools Summary:
- A direct-to-consumer brand shifted its focus from clicks to CPA, targeting users more likely to convert rather than just engage.
- By optimizing for actual purchase actions, the brand increased its return on investment by 25 percent.
- Facebook Ads Manager’s custom conversions feature helps you define and track the key user actions that matter most to your business.
- Integrating Facebook’s Offline Conversion API connects online ads metrics to offline sales data, providing a more accurate and complete view of campaign performance.
By focusing on CPA in 2025, you align your advertising efforts with tangible business outcomes, making every dollar you spend count toward actual growth.
2. Return on Ad Spend (ROAS): Adjusted for Attribution
Return on Ad Spend (ROAS) shows how much revenue you earn per ad dollar spent. A ROAS of 4.0 means $4 back for every $1 spent.
In 2025, ROAS matters even more. Privacy updates like iOS 14 shorten tracking windows, so Facebook often misses delayed or cross-device conversions, making traditional ROAS less accurate.
To adapt, marketers are increasingly relying on adjusted ROAS, a more comprehensive approach that blends:
- Facebook’s reported ad data
- Backend sales figures from your CRM or ecommerce platform
- Detailed customer journey analysis
- Multi-touch attribution models that capture conversions across all touchpoints
In 2025, mastering adjusted ROAS is key to ensuring your ad dollars deliver measurable business growth, helping you make informed decisions even amid a more complex tracking landscape.
3. Conversion Rate by Placement
Conversion Rate by Placement shows how effectively different ad placements such as Reels, Stories, Feed, or Audience Network drive valuable user actions like purchases, signups, or app installs. It helps you see not just where your ads metrics appear but where your audience is actually converting.
Why is it especially important in 2025?
In 2025, this matters more than ever. Meta’s AI now automatically optimizes placements using machine learning, often prioritizing impressions or clicks over meaningful conversions. Relying solely on automation can waste the budget on less effective channels.
To get even more actionable insights, break down conversion rates by additional factors such as:
- Device Type: Mobile often outperforms desktop, especially with formats like Reels that appeal to Gen Z.
- Ad Format: Videos better if presented in Stories and Reels, while images or carousels work better in Feeds and Audience Network.
- Demographics: Parameters such as age, gender, location, and interests shape how users engage, so customize your targeting and creative to match.
Actionable insights to improve your campaigns:
- Shift your ad spend toward placements with the highest conversion efficiency instead of spreading budgets evenly or relying solely on automated distribution.
- Use Facebook Ads Manager’s Breakdown tab regularly to monitor placement-specific conversion rates and identify trends over time.
- Combine this data with creative testing to find which ad formats work best for each placement and audience segment.
This strategic approach leads to smarter budget allocation, better-performing campaigns, and stronger business results in an increasingly complex advertising ecosystem.
4. Frequency: Avoiding Ad Fatigue
Frequency refers to the average number of times a single user has seen your ad over a specific period. For instance, a frequency score of 3 means each user has seen the ad about three times. While some repetition helps with recall, too much can lead to diminishing returns.
Strategies to Manage and Optimize Frequency:
- Creative rotation: Regularly update your visuals, headlines, and calls to action. Even small tweaks can make a difference.
- Message sequencing: Instead of repeating the same message, create a storyline or value progression across multiple ads.
- Audience expansion:
- Use interest stacking to combine multiple interest layers and uncover broader segments.
- Refresh lookalike audiences every few weeks to keep them current and dynamic.
- Use interest stacking to combine multiple interest layers and uncover broader segments.
- Frequency monitoring: In Facebook Ads Manager, keep a close eye on the Frequency metric.
- Ideal range: Aim to maintain a frequency of 1.5 to 3.
- When you notice frequency creeping above 3 with declining performance, it’s time to refresh your creative or expand your reach.
- Ideal range: Aim to maintain a frequency of 1.5 to 3.
5. Engagement Rate (Quality Score 2.0)
Engagement Rate tracks how actively users interact with your ads. This includes likes, shares, comments, saves, reactions, and click-throughs. It’s a key indicator of how engaging, relevant, or emotionally resonant your content is to your audience.
Unlike metrics that focus purely on conversions or impressions, engagement tells you whether people care about what you’re showing them.
Meta’s Upgraded Scoring System in 2025:
Back in the day, Facebook used a basic relevance score to gauge ad quality. But in 2025, Meta has evolved this into a predictive engagement score. This modern scoring system uses machine learning to forecast how likely a user is to engage with a given ad, before it’s even shown.
- The higher your engagement rate, the higher your score.
- A high predictive engagement score leads to better ad delivery, more visibility, and lower CPMs.
Here’s why it matters:
- It acts as social proof: Users are more likely to trust and act on ads that others have already engaged with.
- It boosts organic reach: High engagement can sometimes push your ad into more feed placements without additional spend.
- It improves auction performance: Meta’s ad system favors high-engagement ads by giving them better placement at a lower cost.
Top brands boost engagement by using dynamic creative optimization to personalize ads metrics across user segments, resulting in up to 50% higher click-through rates.
6. Customer Acquisition Cost (CAC): Full Funnel Focus
Customer Acquisition Cost (CAC) measures how much you spend to gain a single paying customer. It goes beyond just ad spend, it includes your full marketing budget: campaign costs, tools, salaries, agency fees, and other overheads.
That’s why CAC is more important than ever. It gives you a full-funnel perspective, helping you zoom out and evaluate the true efficiency of your marketing across all touchpoints, not just what Facebook or Google reports.
Pairing CAC with CLV for True ROI
CAC becomes even more powerful when analyzed alongside Customer Lifetime Value (CLV). Together, they tell you:
- If the cost to acquire a customer is worth it based on how much they’ll spend over time.
- Whether to prioritize short-term wins or long-term relationships.
- Which acquisition channels deliver customers with the highest retention and repeat value.
7. Click-to-Conversion Time: Lag Time Insight
Click-to-Conversion Time tracks the amount of time it takes for a user to complete a desired action, such as a purchase, sign-up, or app download, after clicking on your ad. For more on understanding Facebook ad conversion delays, see Facebook’s official guide on conversion tracking.
Here’s why lag time is now mission-critical:
- If your customer doesn’t convert immediately, the platform might not credit the ad, even though the ad did the heavy lifting.
- Businesses that rely on immediate performance metrics may pause or scale down campaigns that are actually doing well, just on a delayed cycle.
- It provides clarity around true ROI by aligning reporting windows with real consumer behavior.
Different businesses experience different lag times. For example:
- eCommerce brands selling low-ticket items may see conversions within minutes to hours.
- High-ticket items, courses, or B2B offers often have longer sales cycles—ranging from 5 days to even 3 weeks.
A B2B SaaS company improved results by tracking click-to-conversion time over a 14-day window, reducing CPA by 28% and optimizing retargeting based on lag insights.
Conclusion
In 2025, focusing on key metrics like CPA, ROAS, Conversion Rate by Placement, Frequency, and Engagement Rate reveals true campaign performance and drives real Facebook Ads performance metrics.
Outdated KPIs can mislead, but these metrics offer clarity, helping you optimize for meaningful outcomes like purchases and sustained engagement. Let your strategy follow the metrics that align with your goals and customer journey to turn data into action and campaigns into results.
FAQS:
Why is Cost Per Action (CPA) more important than clicks in 2025?
CPA tracks real actions like purchases or sign-ups, showing actual impact. Clicks just show interest, especially unreliable with privacy limits.
How has Return on Ad Spend (ROAS) changed with privacy updates?
ROAS is harder to track now. Shorter attribution and signal loss mean marketers rely on backend sales and multi-touch data for accuracy.
What does Conversion Rate by Placement tell me, and why is it crucial?
It reveals which placements drive results, helping you invest smartly instead of relying on auto distribution that may favor clicks.
How can I avoid ad fatigue using Frequency?
Keep frequency between 1.5 to 3, rotate creatives, vary messages, and broaden audiences to avoid overexposure.
Why is tracking Click-to-Conversion Time essential in 2025?
Conversions can take days. Knowing the delay helps you time retargeting and avoid cutting good campaigns too soon.